


Insights
This blog is the second in our series on the key concepts to consider when thinking about local economic growth policies. We’re using the series to test-drive a way of explaining concepts in economic growth that we hope to use in new training and resources. We are keen to hear from readers, particularly those in local and central government, about whether they find these useful and accessible, and if there are other topics you would like to see us cover.
What is GVA?
The first blog provided an introduction to local economic growth and discussed how local government can improve economic growth. A local economy grows when it increases the amount of goods and services it produces. Gross Value Added (GVA) is a way of measuring this output.
GVA is defined as the value of the goods and services produced minus the value of the intermediate inputs that were used to produce those goods and services. It can be calculated for firms, industries, local and national economies. Subtracting the value of intermediate inputs is important – it avoids double counting, and it gives us the value of output that can be shared out between workers and owners.
- Using a simple example, the added value of a bakery is the value of the bread, biscuits and cakes it sells minus the cost of the ingredients (flour, butter, sugar, etc.) and equipment (mixers, ovens, etc.) it uses to produce these.
- Economic policy aims to achieve high levels of output and to grow the economy over time. At the local level, GVA is a measure that allows progress to be assessed against these goals.
This formula provides a useful way of breaking down GVA:
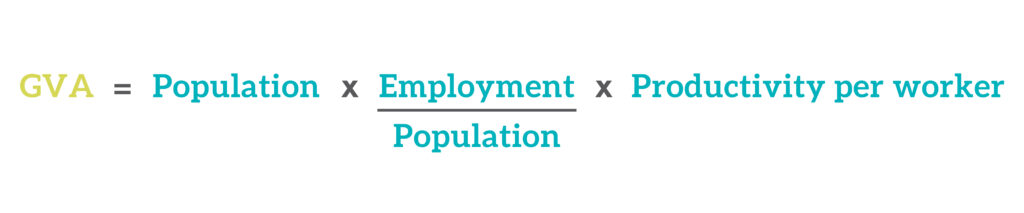
Let’s talk through each of the bits of this in turn.
The first factor is the population of the area. An area with a population of 10 million will generally have an economy that is larger than an area with a population of 2 million. This might not be true if the characteristics of the places are very different – for example, the US has a larger economy than China despite have less than a quarter of population as it produces much more per worker – but if all else is equal, areas with larger populations have higher GVAs.
Only those in employment (either as an employee or working for themselves) contribute to the production of goods and services – so the next consideration is what proportion of the population are in employment. This will depend, in part, on an area’s population structure. For example, whilst older people can and do work, they are much less likely to be in employment than younger people. In areas with a large number of retirees, such as Cornwall or Cumbria, this means a smaller proportion of the population is in employment.
Demand for labour also plays an important role. If demand is weak, many people may wish to work but cannot find a job, meaning the proportion in employment is lower than would otherwise be the case. Other factors can also play a role, including how attractive employment is compared to other options. For example, if childcare costs are high, this may discourage parents from working. Or if a person has accumulated sufficient pension, they may choose to retire early.
The final component is the amount each worker produces – that is, the productivity of those in employment. If each worker produces goods and services with value of £200,000 per year, GVA will be higher than if they each produce goods and services with a value of £50,000.
Why do we need to think about GVA?
Lots of commentators have criticised the policy focus on growing the economy and on the indicators – GVA and Gross Domestic Product (GDP), another measure of output which accounts for taxes and subsidies – used to quantify this. This was eloquently articulated in a 1968 speech by presidential candidate Robert Kennedy where he described GDP as measuring “everything in short, except that which makes life worthwhile”.
The importance of GVA is clearer when we consider its components. Employment matters to individuals – both because of the income it provides and because of the wider health and wellbeing benefits from being in work. Productivity is important because it underpins growth in incomes and living standards over time – and, again, these matter to people.
Whilst it can be interesting to know the overall size of an economy – as measured by GVA – and how this is changing over time, it isn’t particularly helpful for local policymaking. In practical terms, it is more useful to think about:
- GVA per head, as this will matter more for income and allows comparisons to be made between areas of different sizes.
- GVA per worker, which measures productivity, as this will be an important determinant of GVA per head. The next blog will discuss productivity in more detail.
It can be useful to think about both the levels and the rates of growth for these measures.
How can we increase GVA per head?
Increasing GVA per head can be achieved by increasing the proportion of the population in employment or by increasing productivity.
Policies to increase employment could include:
- Supporting businesses to grow and create new jobs.
- Providing training for unemployed residents so they can take up available employment opportunities.
- Improving the availability and affordability of childcare to enable parents to work.
Policies to increase productivity could include:
- Supporting businesses to develop new higher-value products or services.
- Supporting businesses to make their production processes more efficient.
- Improving the skills of workforce.
- Improving management and leadership skills within firms.
What to consider when thinking about GVA per head?
Analysing the components of GVA – an area’s population structure, employment rates and productivity – and how they are changing over time will help understand what is driving an area’s economic performance and design more effective policies.
For example, if the proportion of the population in employment is low, it can be useful to establish how this varies across different groups of the population. If participation is low amongst those aged 50 and over and health outcomes are poor, a different set of policies will be needed than if the main issues are a lower qualifications profile than other areas and high youth unemployment.
For low productivity, different policies will be needed depending on the underlying causes. For example, if the cause is a lack of skilled workers, it is important to understand which skills are missing and how these are normally developed. Should the focus be on increasing take-up of apprenticeships, encouraging graduate retention or upskilling existing workers? If the cause is low levels of product innovation, understanding the reasons for this will help determine whether R&D grants or tax credits, or another approach such as encouraging greater university-business cooperation would be most appropriate.
How can I learn more?
- City-REDI have a useful blog on GVA that includes a definition, examples, and some issues to consider.
- The ONS provides data on GVA for different types of area (regions, local authorities, combined authorities, etc.) and sectors.
Up next
The next blog in our series Understanding key concepts in local economic growth will be on productivity. Sign up to our newsletter to get an update on our next blogs, briefings and events.