


Insights
This blog is the fourth in our series on the key concepts to consider when thinking about local economic growth policies. We’re using the series to test-drive a way of explaining concepts in economic growth that we hope to use in new training and resources. We are keen to hear from readers, particularly those in local and central government, about whether they find these useful and accessible, and if there are other topics you would like to see us cover.
What are spatial disparities?
Spatial disparities occur when socio-economic outcomes differ across places. For example, when some places are more productive than others, we talk about spatial disparities in productivity (see our previous blog for how this is measured). Figure 1 illustrates the extent of these disparities for the UK.
Figure 1: Spatial disparities in productivity (measured using GVA per job), by area, 2019
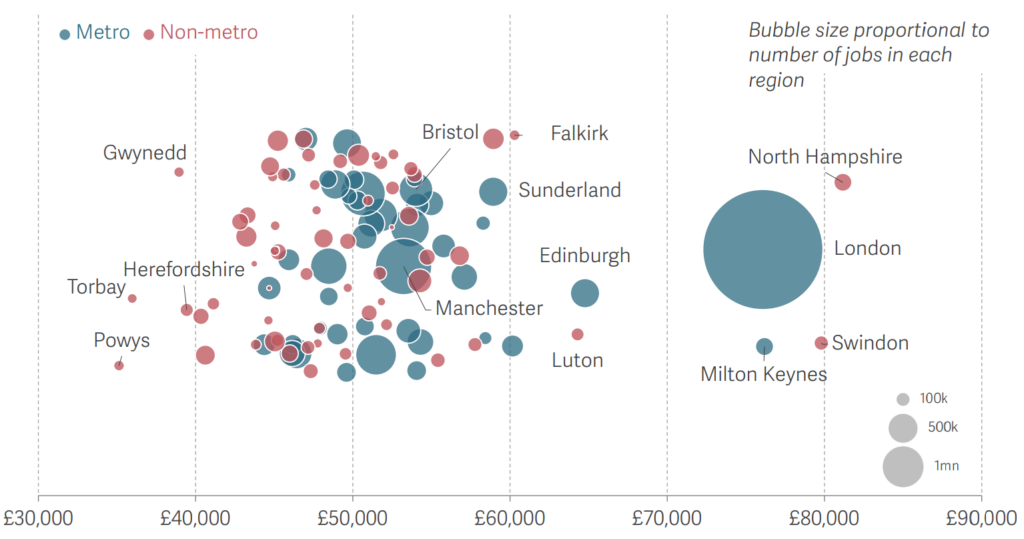
Source: Brandily, Distefano, Donnat, Overman and Shah (2022). Bridging the Gap. What would it take to narrow the UK’s productivity disparities?
Note: See report for details on how metro and non-metro areas are defined.
The extent of spatial disparities, and the ranking of different areas, can differ a lot across different outcomes – even those that seem closely related. For example, as shown in Figure 2, spatial disparities in GVA per capita (the first plot) are much bigger than disparities in employment (the fourth). And places that might have high incomes before housing costs (Slough and London; BHC, the sixth plot) aren’t necessarily the same as those that have high incomes after housing costs (Basingstoke; AHC, the seventh plot).
Figure 2: Spatial disparities and the ranking of individual travel to work areas for different outcome measures, 2018
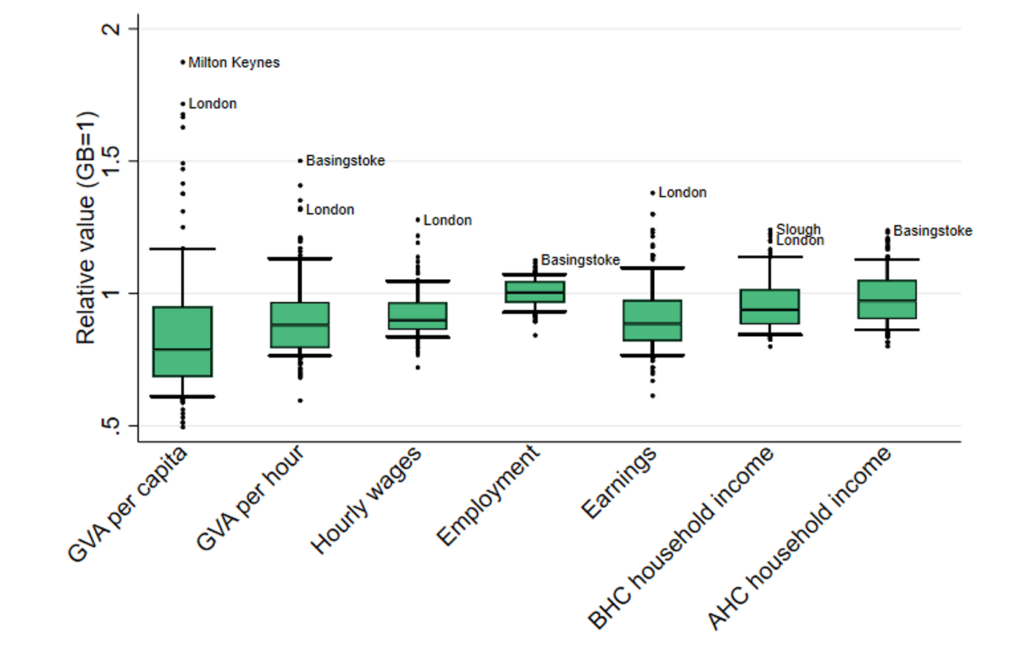
Source: Overman and Xu (2022). Spatial disparities across labour markets.
Note: These ‘box and whisker’ plots summarise the distribution of area averages relative to the national average for different outcomes in 2018. The upper and lower bounds of the ‘box’ are the 25th and 75th percentiles, the line in the middle the median. ‘Whiskers’ correspond to the 10th and 90th percentiles. ‘Dots’ are for areas in the top or bottom 10% of area averages.
Why do we need to think about spatial disparities?
At the area level, spatial disparities in economic outcomes tell us about differences in how local economies are performing and whether this is changing over time. And underlying these spatial disparities in area level outcomes are outcomes for individual firms and workers. On average, firms in a low productivity area will tend to have low productivity. Similarly, on average, workers in a high wage area tend to earn high wages, while households in a high-income area will tend to have higher incomes.
Should we try to reduce spatial disparities?
Whether we should care about any of these disparities – and hence whether we should try to reduce them – will depend on the outcome we are looking at and the question we are asking. For example, if we’re interested in real incomes then spatial disparities in earnings won’t tell us much if higher earnings tend to be offset by higher house prices.
Or it might be that the outcome matters for some but not others. Differences in productivity, as measured by GVA per hour, might matter a lot for firms thinking about where to locate, but not for pensioners thinking about where to live. Having some high productivity places (for example, London) and some low productivity, but nice to live places (rural Cornwall) might be a good thing, given that firms and pensioners compete for land on which to build workplaces and homes.
Even when we’re confident that there is probably a good case for reducing disparities – for example in productivity between London and other parts of the country – it’s important to remember that policy often doesn’t affect disparities directly. Reducing spatial disparities in productivity involves decisions about where to make investments and where different types of firms and workers will be based. Once we recognise that these are the things we need to change, then policy making becomes more complicated – for example because reducing disparities in business investment involves investing in some places, not others so a desire to ‘reduce disparities’ turns into the much trickier question of ‘where to invest’.
What to consider when thinking about spatial disparities?
In addition to making sure we’re considering the right spatial disparities for the policies we are seeking to inform, we also need to recognise two complications. First, spatial disparities partly reflect individual inequality. For example, if individual inequality increases and poorer families are concentrated in some areas, then spatial disparities will also increase. To understand spatial disparities, we need to distinguish carefully between the roles played by people and by place and by the interaction between the two. Second, the link between individual and spatial disparities is also complicated by the fact that people can move around and that the ability to move often depends on income. This means that policies targeted at specific places don’t necessarily benefit the place – for example if improving educational outcomes helps people move away. Worse, policies aimed at a particular place might not end up benefitting the people that we hoped to help – for example, if regeneration drives up rents and forces out lower income families.
How can I learn more?
- People, places and politics: the challenge of ‘levelling up’ the UK provides a short introduction to the factors driving spatial disparities and suggest some policy responses.
- The Institute for Fiscal Studies Deaton Review report Spatial disparities across labour markets provides an overview of UK spatial disparities in employment and wages.
- The Economy 2030 Inquiry report Bridging the gap considers how to narrow the UK’s spatial disparities in productivity. A short blog from the report’s authors gives an overview.
Up next
The next blog in our understanding key concepts in local economic growth series will be on supply and demand. Sign up to our newsletter to get an update on our next blogs, briefings and events.